The global fertility crisis: why birth rates are falling
In many countries, the number of children per woman is declining, while some people are unable to have the family size they want. A lower birth rate does not prove that everyone is becoming biologically less fertile. This article distinguishes demographic data from medical findings and explains the roles of living conditions, age and health.


At a glance
- The number of children per woman worldwide has fallen sharply: annual UN estimates show about 4.85 in 1950 and 2.25 in 2023.
- A low fertility rate is a demographic indicator. It does not prove that individuals are becoming biologically less fertile.
- Family planning depends on personal wishes, relationships, age, health, childcare, housing and financial security, among other factors; their importance varies across countries and life situations.
- The WHO statement that about one in six adults experiences infertility refers to their lifetime so far, and is not evidence of an increase over time.
What does a fertility crisis actually mean?
The term fertility crisis often brings together different concerns: fewer children are being born, people have fewer children than they want, or pregnancy does not happen despite wanting a child. These issues are linked, but they are not the same. A low number of children per woman therefore cannot diagnose the biological fertility of a population.
In medicine, fertility usually means the ability to achieve a pregnancy. In demography, it concerns births actually observed. Four terms help clarify this:
- Number of births
- The absolute number of children born during a given period. It also depends on how many people are at the ages when starting a family is typical.
- Birth rate
- Usually the number of live births per 1,000 people in one year. Since the denominator includes the whole population, its age structure affects this rate.
- Total fertility rate, or TFR
- The calculated number of children a woman would have if a given year's age-specific birth rates remained unchanged throughout her reproductive life. It is a snapshot of birth patterns, not a prediction for one woman or an entire generation.
- Biological fertility
- The physical conditions needed for pregnancy to occur. Age, health conditions and the fertility of both people involved matter; a national fertility rate cannot reveal these conditions.
The often quoted replacement level of about 2.1 children per woman also needs context. Where mortality is low, it roughly describes one generation of parents being replaced by the next. Whether a population actually grows or shrinks also depends on its age structure, immigration and emigration. A figure of 2.1 does not immediately stabilise a population.
How much has the global fertility rate fallen?
The long-term decline is real. In the United Nations' consistent annual estimates, the global total fertility rate fell from 4.852 children per woman in 1950 to 2.251 in 2023, a decline of about 54 per cent. The comparable figure for 1990 is 3.31. The figures use the World Population Prospects 2024 data revision, presented by Our World in Data.
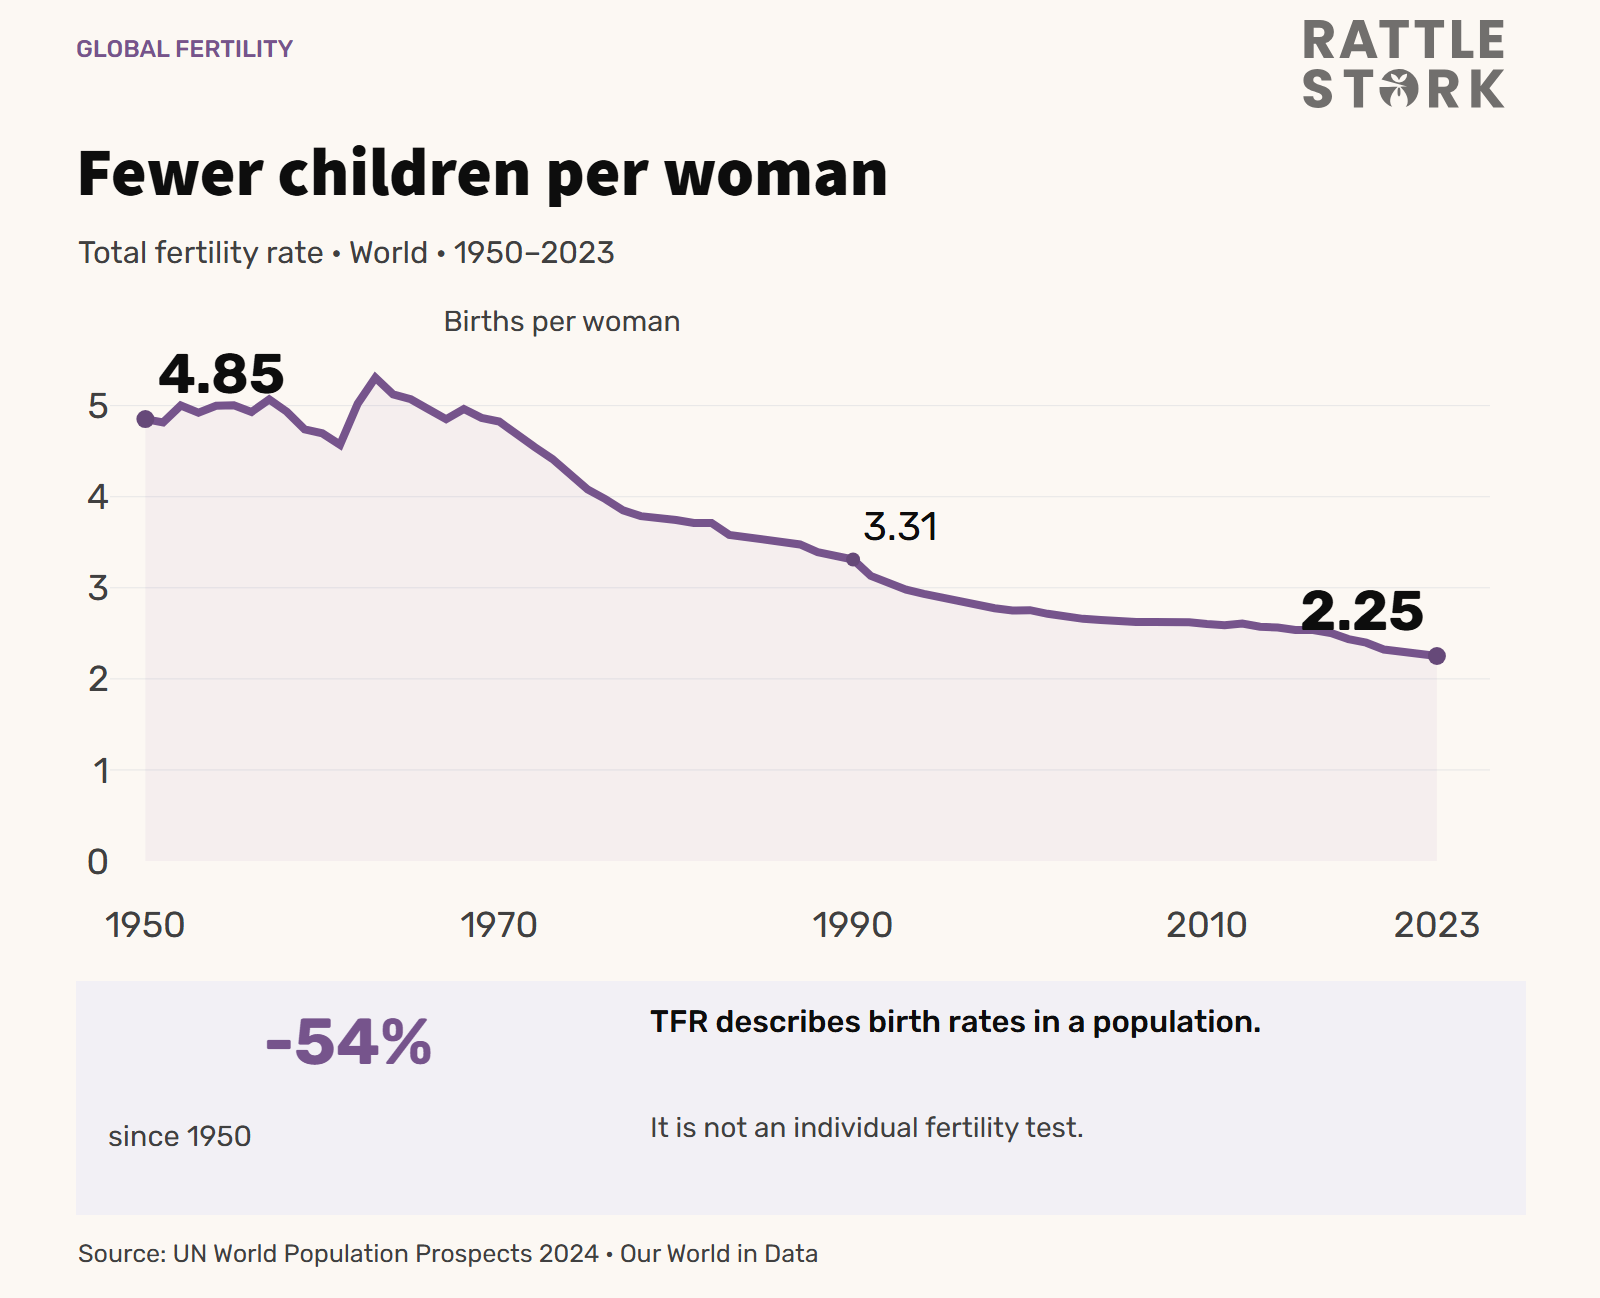
The chart shows historical annual estimates up to 2023. Comparisons need a common data revision and a distinction between estimates and future projections.
The timing of births matters when interpreting these figures. When people have children later, the TFR may initially fall even if some of those births happen later on. A generation's actual completed family size can only be assessed once its childbearing years are largely over. A decline in an annual indicator therefore does not automatically mean that every generation has proportionately fewer children.
Countries and regions compared using the same data year
Differences are large. To avoid mixing statistical years, all the values below refer to 2023 and the same UN data revision. The chart places seven selected countries alongside a global benchmark; it is not a ranking of all countries.
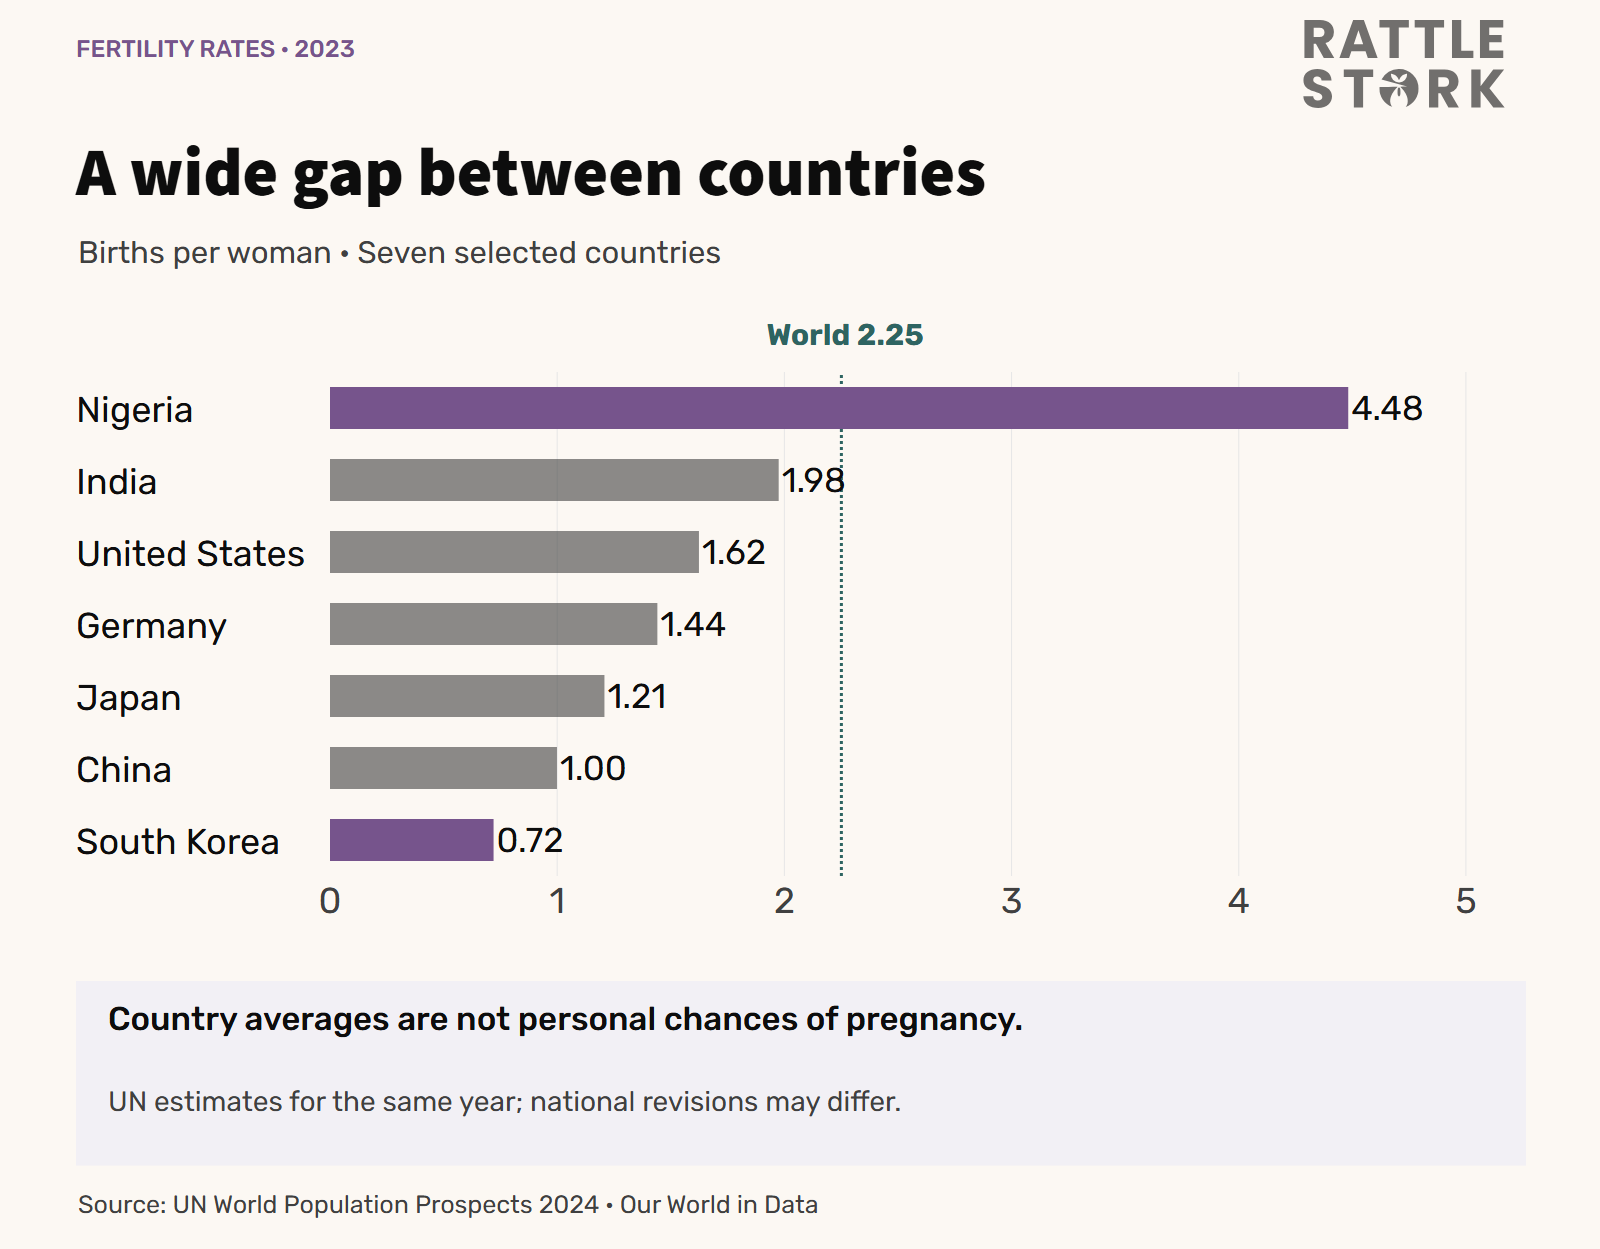
Selected values in children per woman, rounded to two decimal places:
- World: 2.25; Africa as a region: 4.06.
- Nigeria: 4.48; India: 1.98.
- Germany: 1.44; Russia: 1.45.
- Japan: 1.21; South Korea: 0.72.
- China: 1.00; Thailand: 1.21.
- Italy: 1.20; Spain: 1.21.
- United States: 1.62; United Kingdom: 1.56.
The underlying UN series makes this consistent comparison possible. More recent national publications may give other values, for example after a revision or for a later year. This is not necessarily a contradiction. Country and regional averages also hide large differences within populations.
Why people have fewer children or start later
Family planning rarely depends on a single reason. Some people consciously choose no children or fewer children. Others do not find a suitable partner, postpone starting a family or have a smaller family than they want. Which explanation matters most differs across countries, generations and circumstances.
For people who want children, several practical barriers often overlap:
- Housing and living costs: a larger home, regular expenses and financial reserves affect the decision to have a child or another child.
- Work and income: temporary contracts, unpredictable shifts or fears of career disadvantages can make planning harder.
- Childcare and time: dependable childcare offers limited help if its hours do not fit work and commuting schedules.
- Sharing care work: someone who handles most appointments, household tasks and childcare has less capacity for further responsibilities.
- Relationships and support: the absence of a stable relationship or a small support network can postpone plans for children.
- Expectations about the future: economic insecurity and worries about the future may change existing wishes or hold back plans.
The 2025 UNFPA report highlights the gap between wishes and reality. In its survey in 14 countries, 39 per cent said financial constraints had affected, or were expected to affect, their desired family size. These are self-reports from a limited selection of countries, not a worldwide breakdown of the causes of all births that did not happen.
The survey does not establish a general ranking of social and medical causes.
The role of biological limits
The later people try to have the children they want, the more biological limits may matter. This involves more than planning well: some people cannot start earlier, while others face health problems regardless of age.
Egg numbers and egg quality decline with age, and pregnancy risks change. Male age can also matter, although the patterns differ and the boundaries are less clear-cut. An average effect of age is not an individual prognosis. The articles on age and female fertility and the effect of age on sperm explain the basics.
Ovulation disorders, endometriosis, fallopian tube damage, impaired sperm production and other conditions can also make conception harder. Better diagnosis may make these problems more visible. The number of diagnoses alone therefore does not show whether biological fertility is declining overall.
How common is infertility really?
Infertility is a real and widespread health burden. The WHO defines it as not achieving a pregnancy after at least 12 months of regular unprotected sexual intercourse. This definition does not mean that people with known problems should always wait a year before seeking advice.
The often cited statement that about one in six adults is affected refers to infertility at some point in their lifetime so far. The pooled lifetime estimate is 17.5 per cent, with a 95 per cent confidence interval of 15.0 to 20.3 per cent. It comes from the 2023 WHO analysis and the systematic review by Cox and colleagues, covering studies from 1990 to 2021.
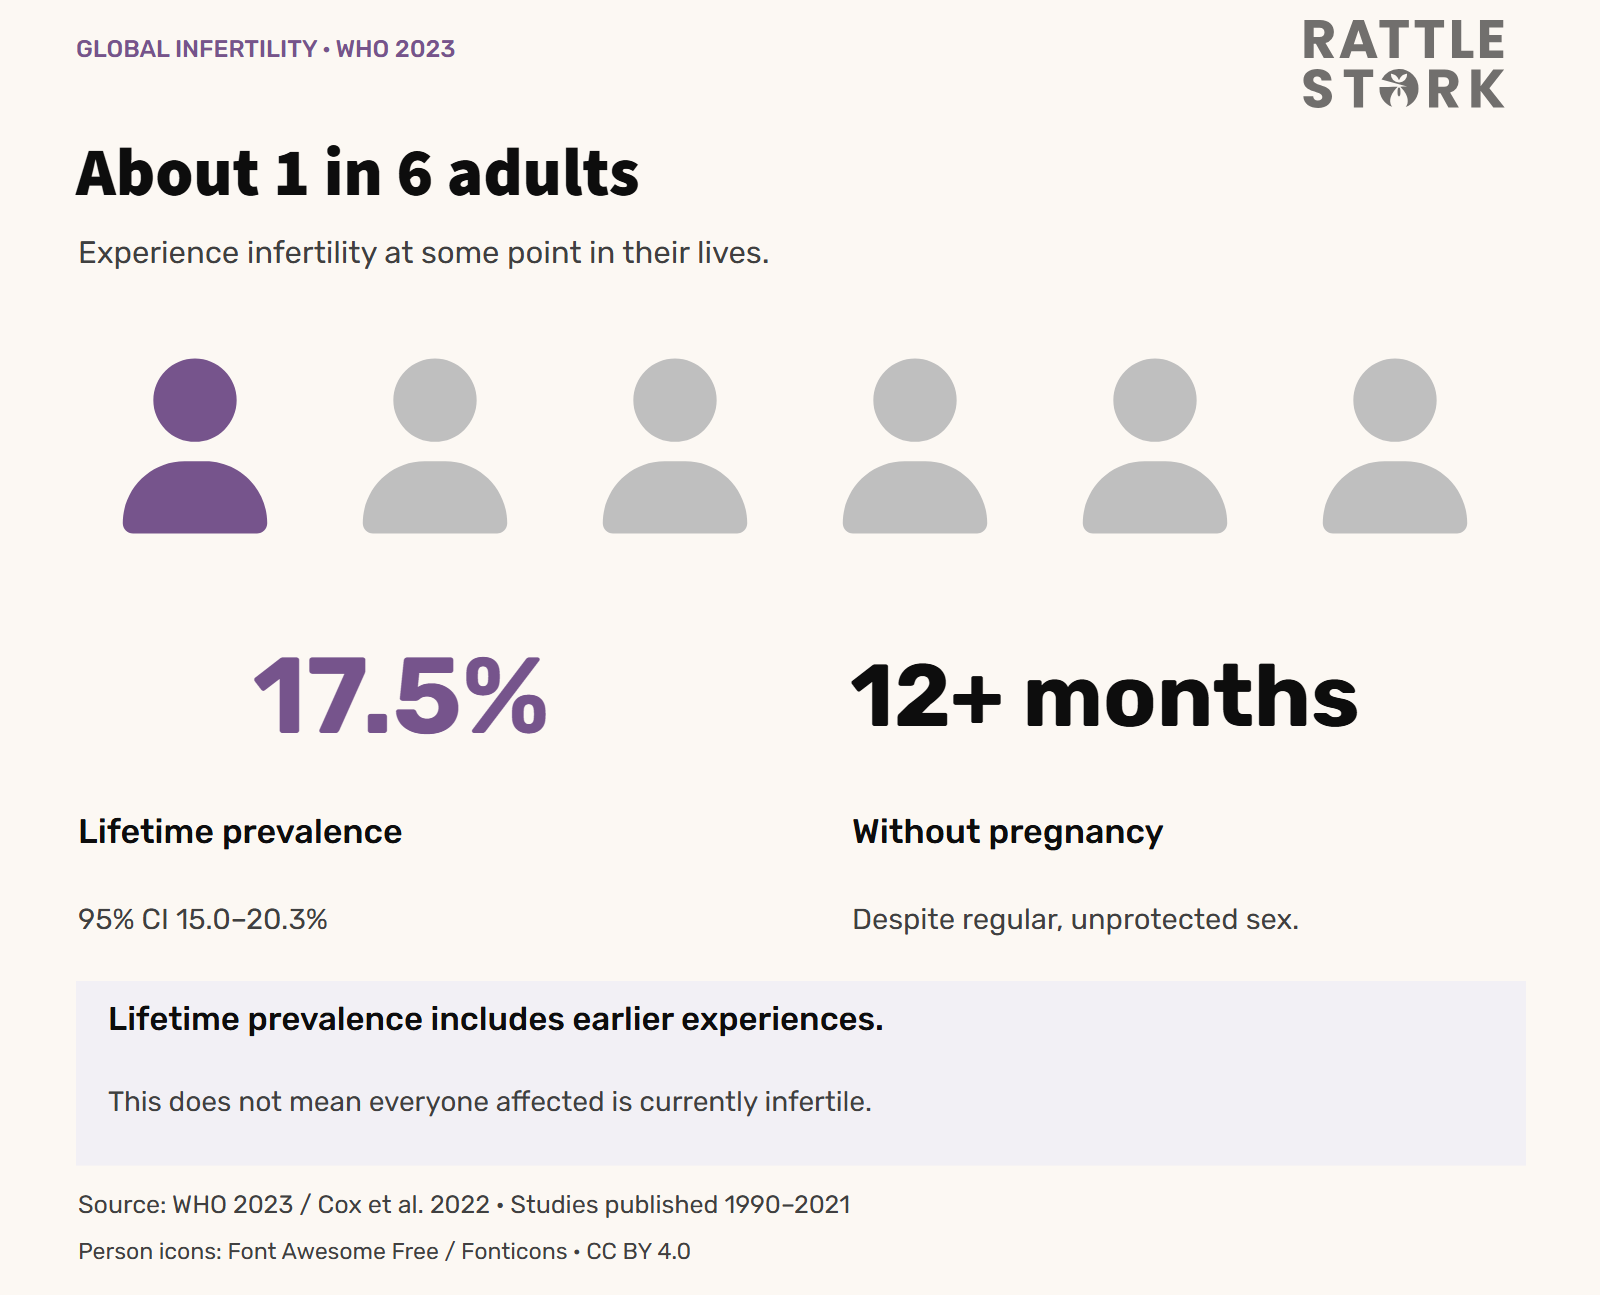
This means neither that all these people are currently infertile nor that they are permanently unable to have children. The review also reports a period prevalence of 12.6 per cent for defined study periods. These figures are not a before-and-after comparison: their reference periods and study populations differ, so an increase cannot be inferred. The substantial variation between the studies also needs to be considered.
Declining sperm counts: what studies show and what remains unclear
A possible decline in semen quality has been discussed in research for years. A large meta-analysis by Levine and colleagues describes falling sperm concentrations and total sperm counts between 1973 and 2018 across the studies assessed. This finding deserves serious attention.
It cannot, however, be treated as a complete count of all men worldwide. Semen samples come from different populations, and recruitment, testing methods and regional coverage vary. The review by Auger and colleagues explains these methodological limitations and considers which regional observations can be generalised.
Observed declines should not simply be dismissed. Equally, a fall in a sperm measure is neither the same as an equally large fall in the chance of pregnancy nor an explanation for a particular share of declining births. Answering those questions would require sperm measures, actual pregnancies and social conditions to be examined together.
Why the world population can still grow
Fewer children per woman does not mean the world population immediately shrinks. In the same UN estimates, the world population grew from about 2.49 billion to 8.09 billion between 1950 and 2023, while the TFR fell substantially. The two indicators measure different things.
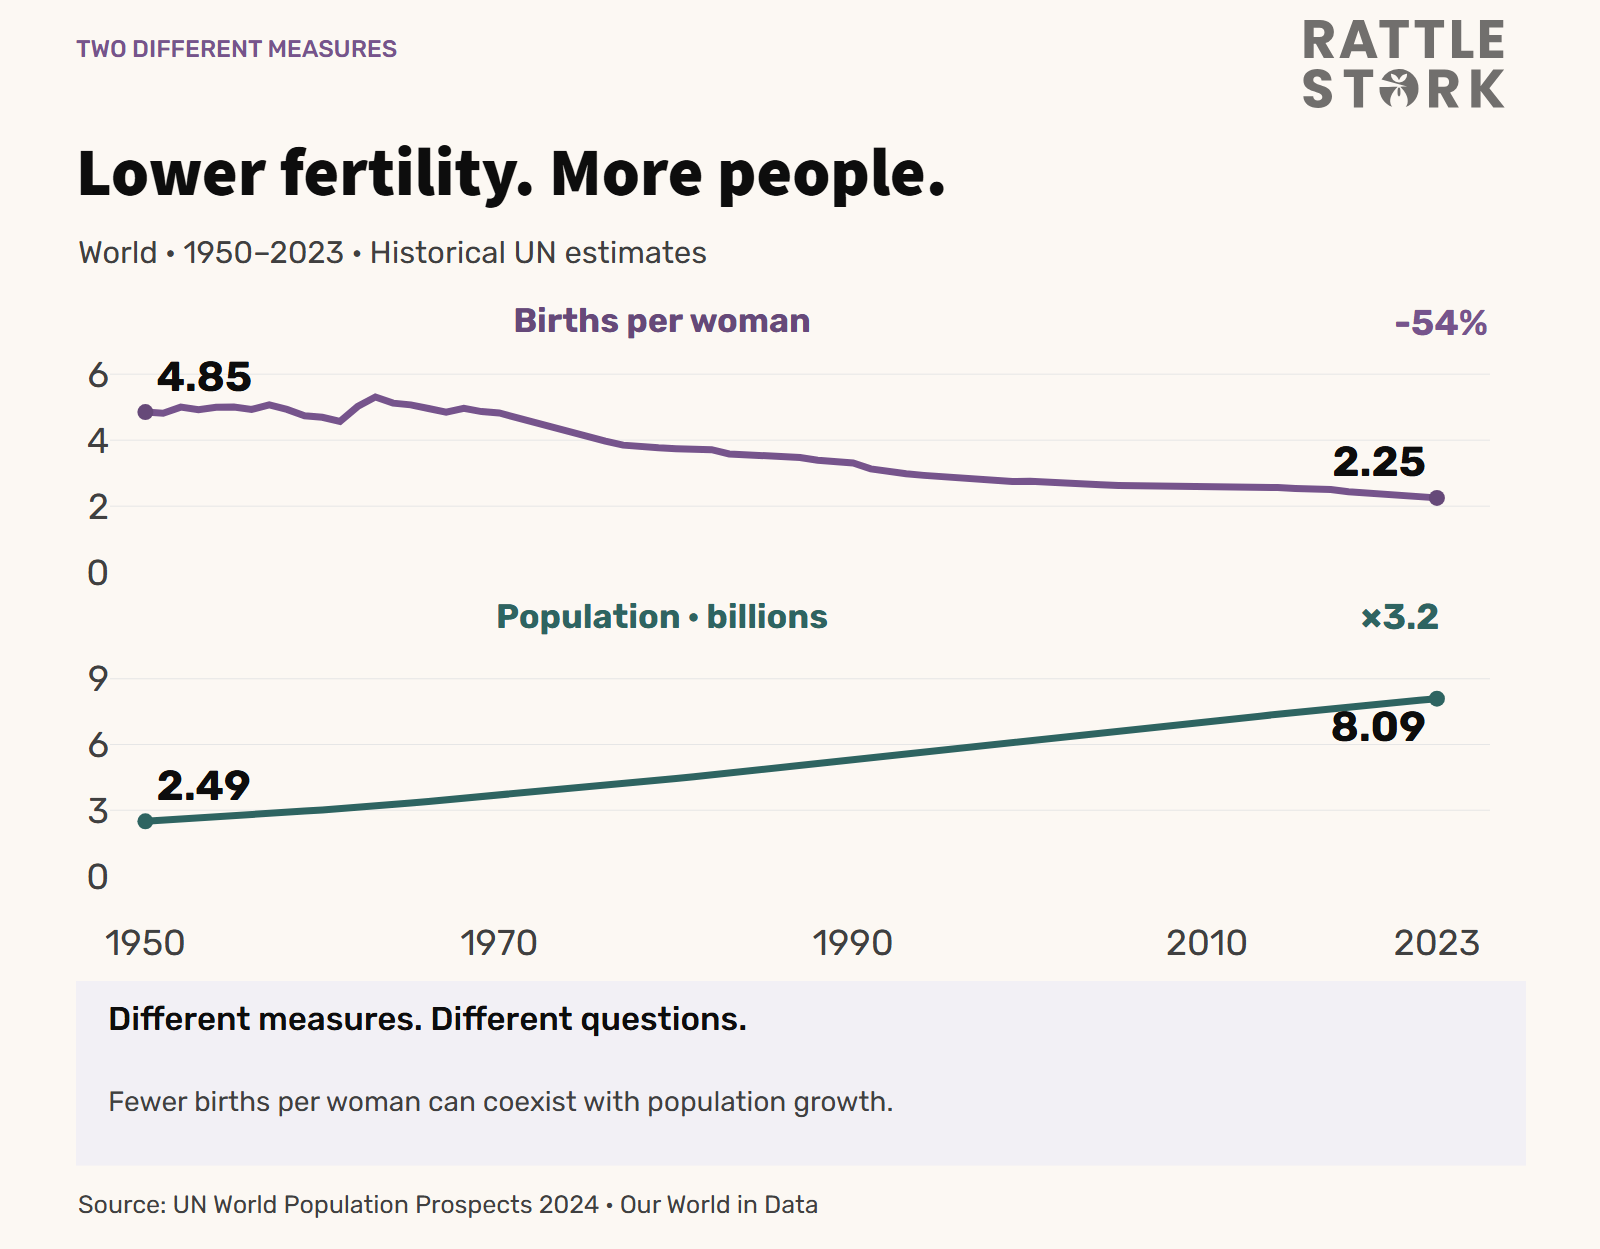
The number of births also depends on the size of the generation becoming parents. Deaths and life expectancy affect population size too. Growth may therefore continue for a while even when children per woman are already declining. The 2023 global figure of about 2.25 also remains above the commonly used replacement benchmark of about 2.1. UN population data through Our World in Data.
The demographic effects of fewer births
If younger generations remain smaller for an extended period, the age structure shifts. The scale of the consequences depends on the country, region and policy choices.
- Work and services: smaller younger generations may make recruiting skilled staff harder, including in nursing and other sectors with high staffing needs.
- Social protection: the balance between working people and retirees changes how pensions, healthcare and long-term care are funded.
- Regional infrastructure: some places need fewer school places and more services suited to older people at the same time. Others may keep growing as people move in.
- Adaptation: immigration, productivity, workforce participation and dependable infrastructure offer different ways to respond.
These consequences make the decline a policy concern. They do not create an obligation for individuals to have children. Good family policy supports people's own decisions rather than holding private life plans responsible for a numerical target.
The fertility crisis: common myths checked
- Myth: COVID-19 vaccines explain the decline in births.
- The WHO finds no evidence that COVID-19 vaccines interfere with fertility. The long-term decline in demographic data also begins well before 2020. Events overlapping in time do not establish causation. WHO information on COVID-19 vaccines.
- Myth: The pandemic explains all persistently low birth rates.
- Pandemic years can shift decisions and contribute to short-term drops or later catch-up births. Lasting effects need to be studied by country and period. That cannot replace looking at developments over decades.
- Myth: Medical infertility explains the entire decline in births.
- Infertility is relevant, but birth numbers also depend on people's wishes, the number of potential parents and their living conditions. Medical prevalence alone does not explain a demographic time series.
- Myth: Environmental toxins such as BPA are the single cause.
- Environmental influences are among the questions studied in reproductive health research. They do not provide a simple explanation for country differences or the entire decline in births. A plausible biological mechanism is not yet evidence of its share in a population trend.
- Myth: Higher education and employment inevitably prevent people from having children.
- Education and employment change life paths and can delay starting a family. Whether this leads to permanently fewer children also depends on support and the ability to combine work and family. There is no inevitable link for an individual.
- Myth: Only wealthy industrialised countries are affected.
- Falling fertility rates are seen in very different world regions. Their pace and starting levels vary, as the UN data show. A common trend does not imply identical causes in every country.
- Myth: A crisis is automatically followed by a lasting baby boom.
- Postponed births can happen later. But a short-term rise proves neither a permanently larger desired family size nor a long-term reversal of the trend.
- Myth: Low birth numbers mean nobody wants children any more.
- Some people consciously choose no children or a smaller family. For others, practical barriers prevent or delay the family size they want. These situations should be distinguished.
What this means for your own family planning
A global figure cannot tell you what your personal path will look like. It is more useful to ask whether you want children, what conditions you need and which health issues actually matter in your situation.
- Discuss wishes and circumstances: timing, sharing responsibilities, finances and support need not be perfect, but should be discussed openly.
- Separate information from pressure: age matters biologically, but a statistic cannot replace a conversation about your life circumstances.
- Support your health sensibly: not smoking, physical activity, a balanced diet and responsible alcohol use are reasonable foundations. They do not guarantee pregnancy or resolve every fertility disorder.
- Seek specific advice about symptoms: very irregular or absent periods, severe pain, known conditions or abnormal previous findings call for an individual medical assessment.
- Know when to seek evaluation if pregnancy does not happen: with regular unprotected intercourse and no known risk factors, evaluation is recommended after 12 months for women under 35 and after six months from age 35. Over 40 or with known risks, earlier advice may be appropriate.
The 2026 ASRM guidance on fertility evaluation stresses that investigations should be targeted and place as little burden on people as possible. People who need donated sperm or medical support for their family-building path, for example, do not first have to demonstrate unsuccessful attempts over these periods before seeking advice.
This does not support blanket early testing for everyone. One laboratory result cannot reliably predict future fertility. If evaluation is needed, possible factors on both sides should be considered. The appropriate treatment depends on the findings: intrauterine insemination (IUI), in vitro fertilisation (IVF) and intracytoplasmic sperm injection (ICSI) are different procedures; testicular sperm extraction (TESE) is a surgical method of retrieving sperm.
For practical background, read about ovulation and the fertile window, IUI, IVF and ICSI. For planning further ahead, the overview of elective egg freezing, including its limitations, may also help.
What policymakers and employers can contribute
Helping people have the family life they want takes more than a single financial incentive. It requires conditions that remain dependable for years:
- Affordable childcare with hours that fit actual daily routines.
- Predictable working hours and a fair division of paid work and care.
- Accessible housing and less economic insecurity.
- Access to reproductive healthcare and understandable advice.
- Support for different family forms and people caring for relatives.
The OECD analysis of fertility and family policy discusses childcare, working conditions and housing costs, among other factors. Individual measures work within their context; even extensive family policies do not guarantee a particular birth rate. Their value also lies in improving quality of life and freedom of choice.
Conclusion
Fewer births in many countries and fewer children per woman worldwide are well-supported demographic developments. Health limitations and unfulfilled wishes for children are also real. None of these statements explains the others on its own. Understanding the fertility crisis therefore means considering birth patterns, biological fertility and the conditions for family life together, without treating them as equivalent. For your own plans, sound information, appropriate support and timely advice when needed are more useful than dramatic headlines.
Read more
More about the effects of age on fertility and planning your own timeline.